Creating and Using Graphs
Graphs are a set of nodes and links that interconnect them, nodes can have a set of inputs and outputs. A graph describes the processing steps necessary to generate a synthetic dataset. Graphs are stored in a workspace.
Create a Graph
To create a new graph, go to the main workspace page and click on the New Graph button. The new graph pop up will be displayed as shown below.
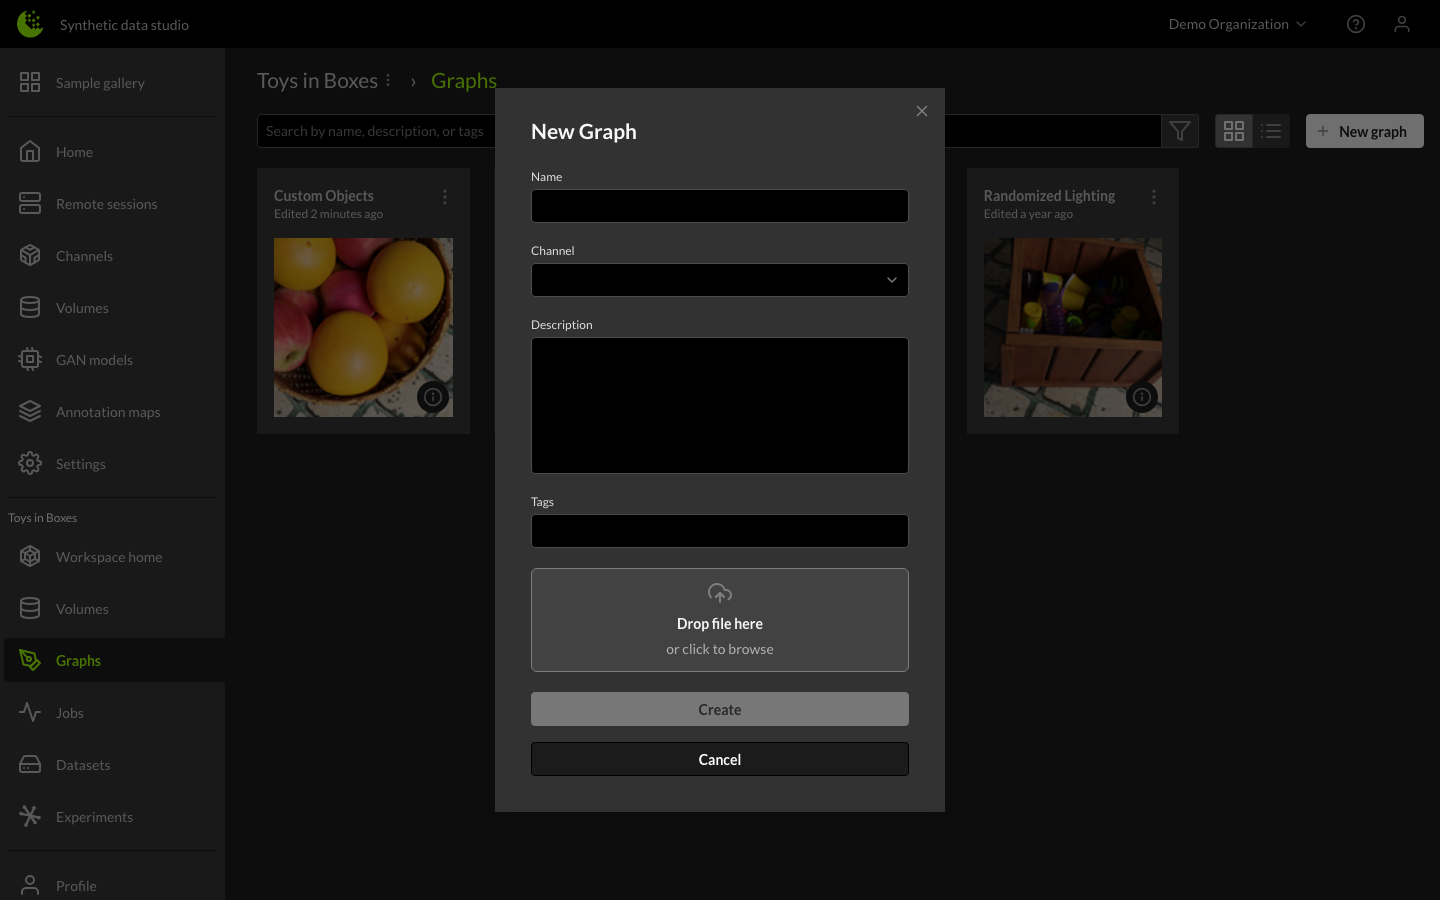
Enter a name for the graph, select a channel, and enter a description of the graph. Finally, click on the Create button. A new view opens with the default graph for that channel.
Canvas View
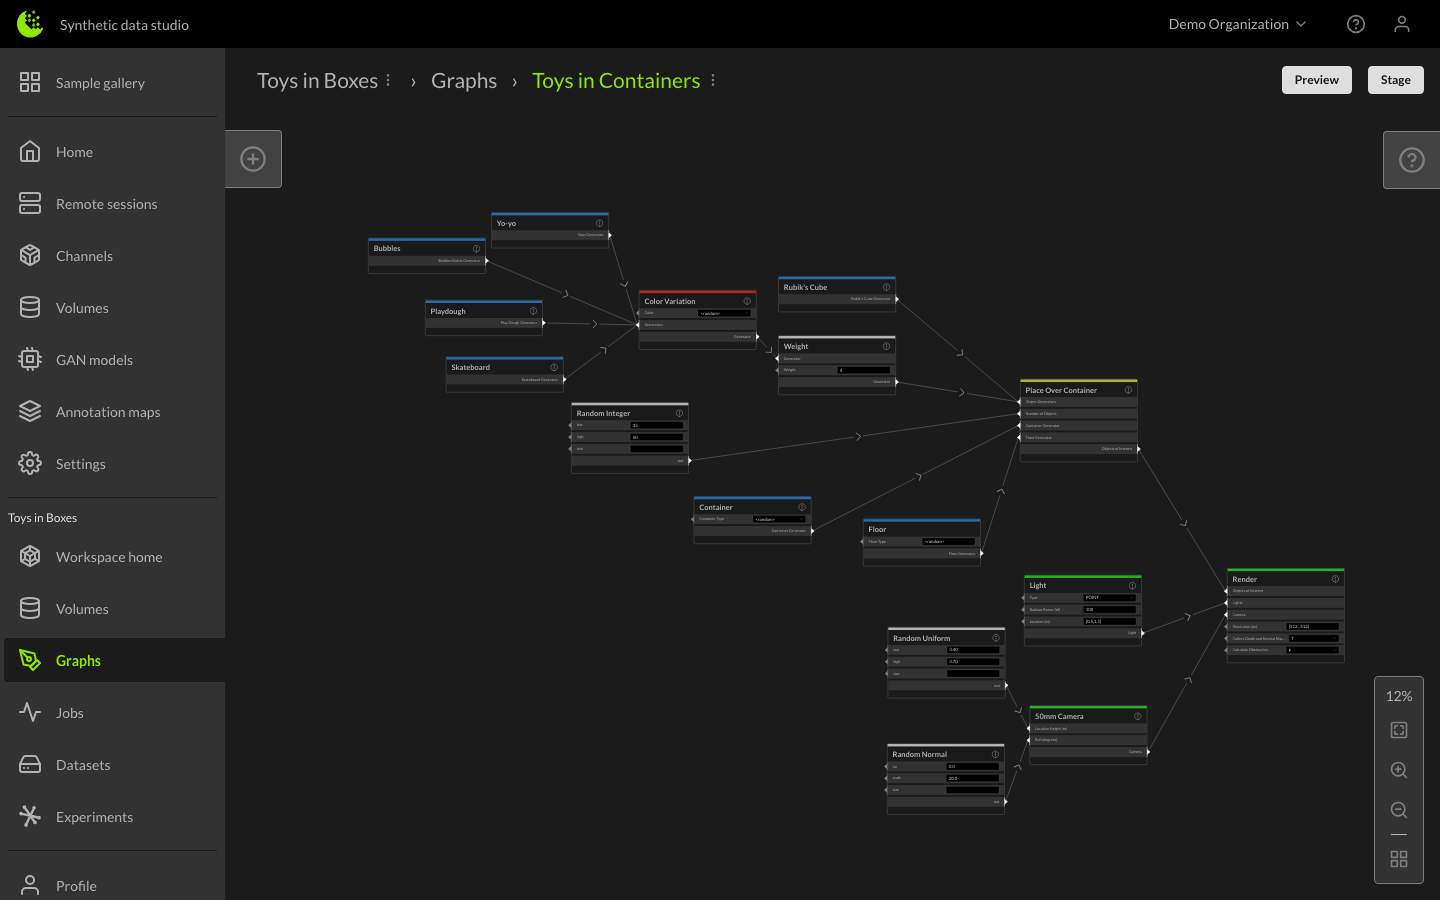
New graph views are pre-populated with a default graph composed of a few nodes and links. This editable graph can be staged or saved for jobs manager use.
How to use the editor
- The canvas can be panned by left clicking on an open area and dragging the canvas.
- The canvas can be zoomed either by holding Ctrl and using the scroll wheel or by using the buttons on the lower right.
- Multiple nodes can be selected by holding Shift while clicking the left mouse button and dragging.
Nodes and links
Adding nodes is done from the menu of nodes which is accessed via the circled plus icon on the left portion of the screen. Also, new nodes can be created by duplicating existing nodes on the graph.
Nodes can be deleted via the trash can icon that appears when a group of nodes is selected, or by pressing Delete or Backspace.
Nodes can have inputs and outputs. Some inputs can appear as text fields or dropdown selectors, but all inputs have a port for linking a node. These links are how information is passed between processing steps.
Links are added by mouse clicking the needed input/output ports. Links are deleted by first selecting the link and either pressing Delete or Backspace.
Note: At this time, there is no 'Undo' capability. To back up graphs, it's possible to duplicate a graph by clicking on the three-dot icon on the top-left of the Graph, then selecting Save As.
In-tool Help
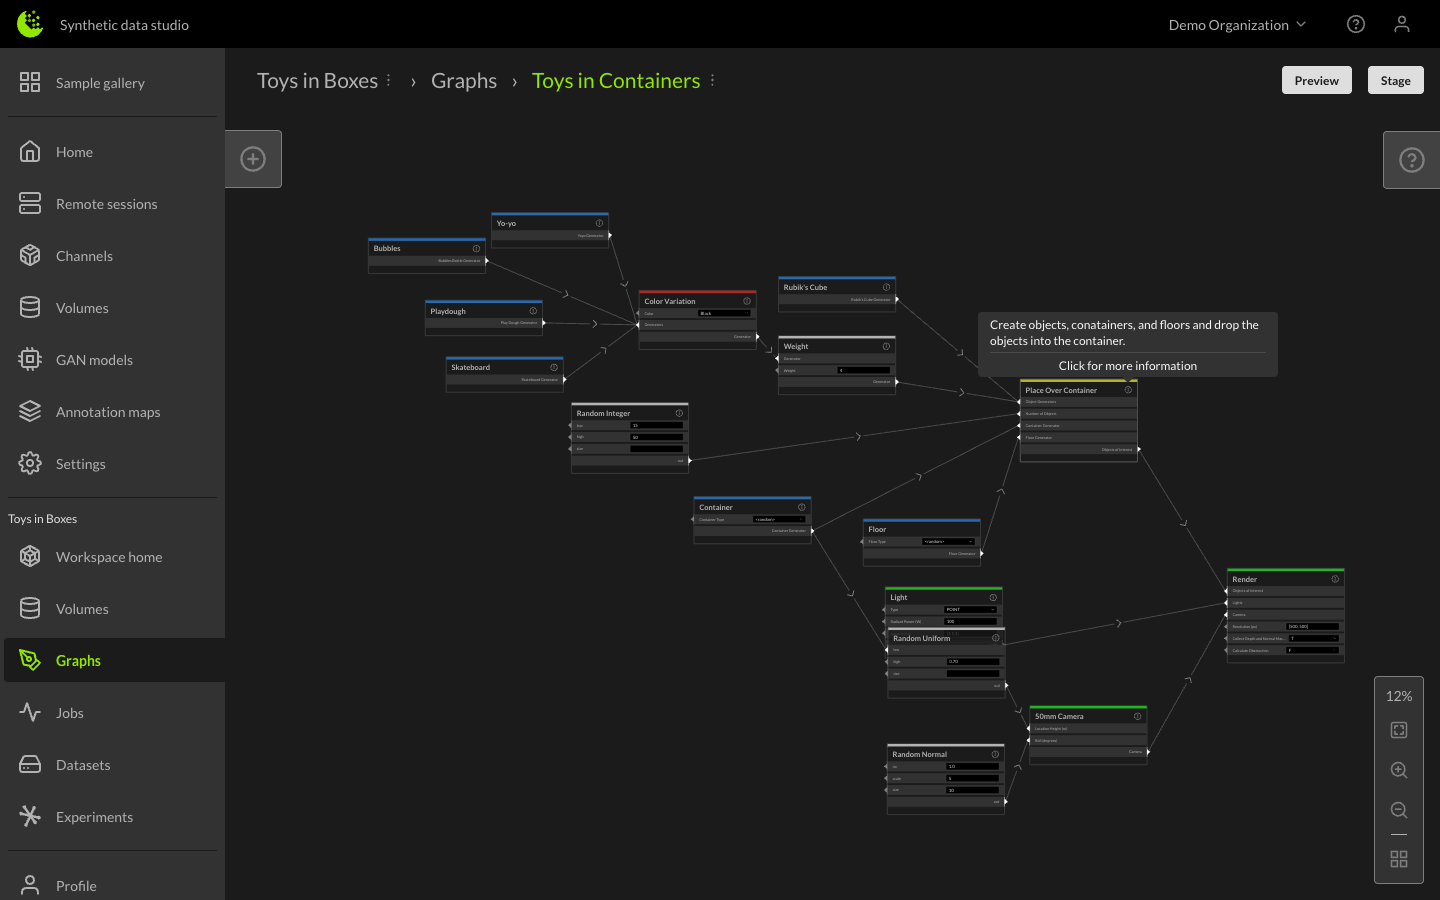
Some channels provide in-tool help for the graph editor. This takes the form of thumbnails of node objects and help text that describes how a node will work.
Thumbnails show up in the node tray on the left of the GUI when you hover over a node name.
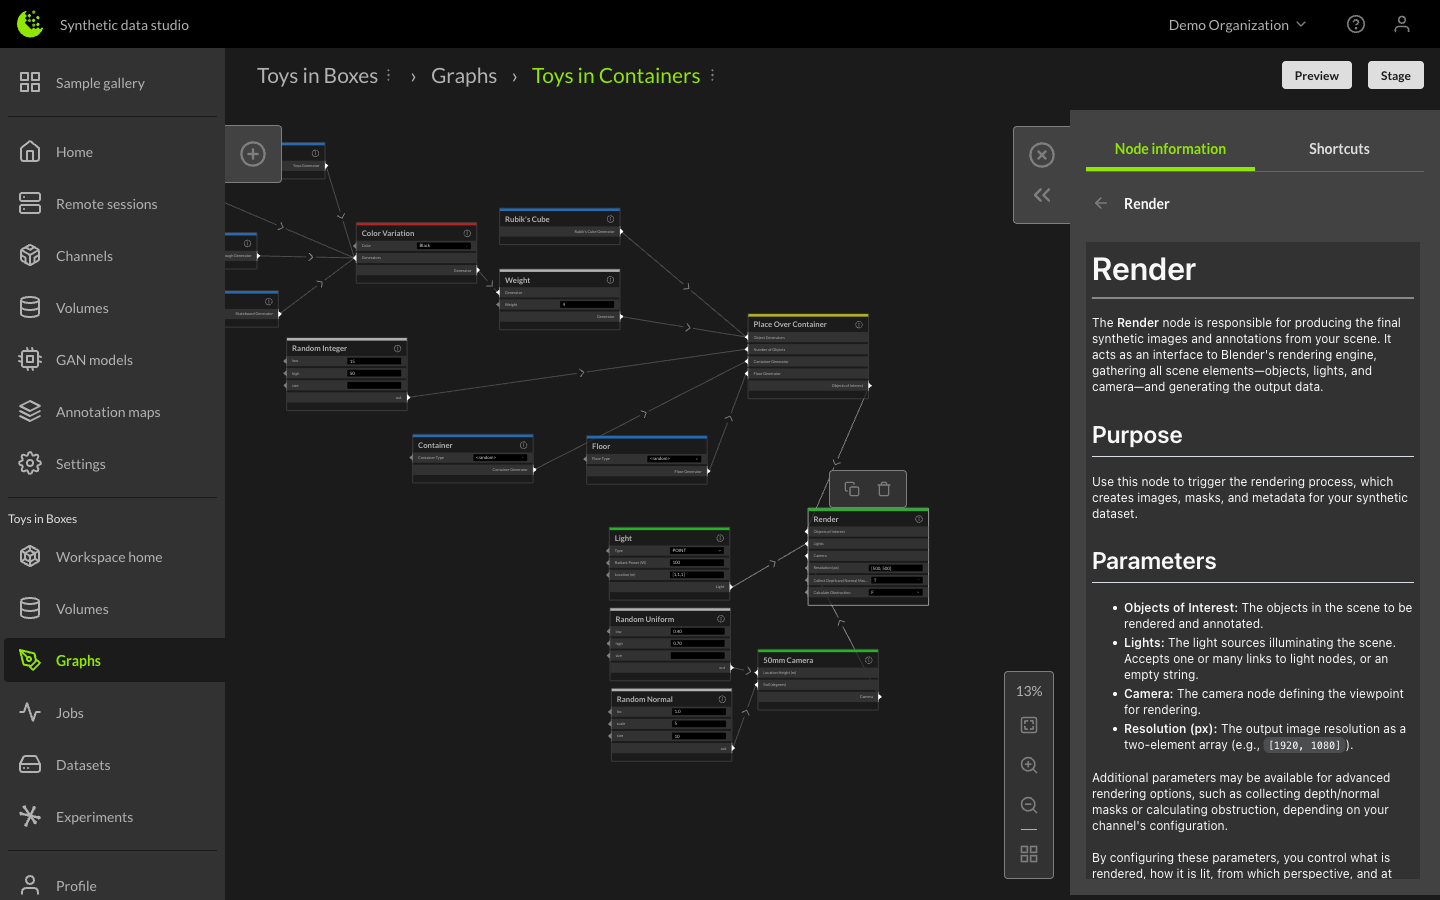
Node help text is displayed in a tray on the right side of the GUI when you click on the "i" icon of a node.
Preview
Channels can implement a preview capability that allows a sample image to be generated from the current graph state. Clicking the Preview button will bring up a "Generating preview..." message, then when the image is ready it will display the image in the middle of the graph.
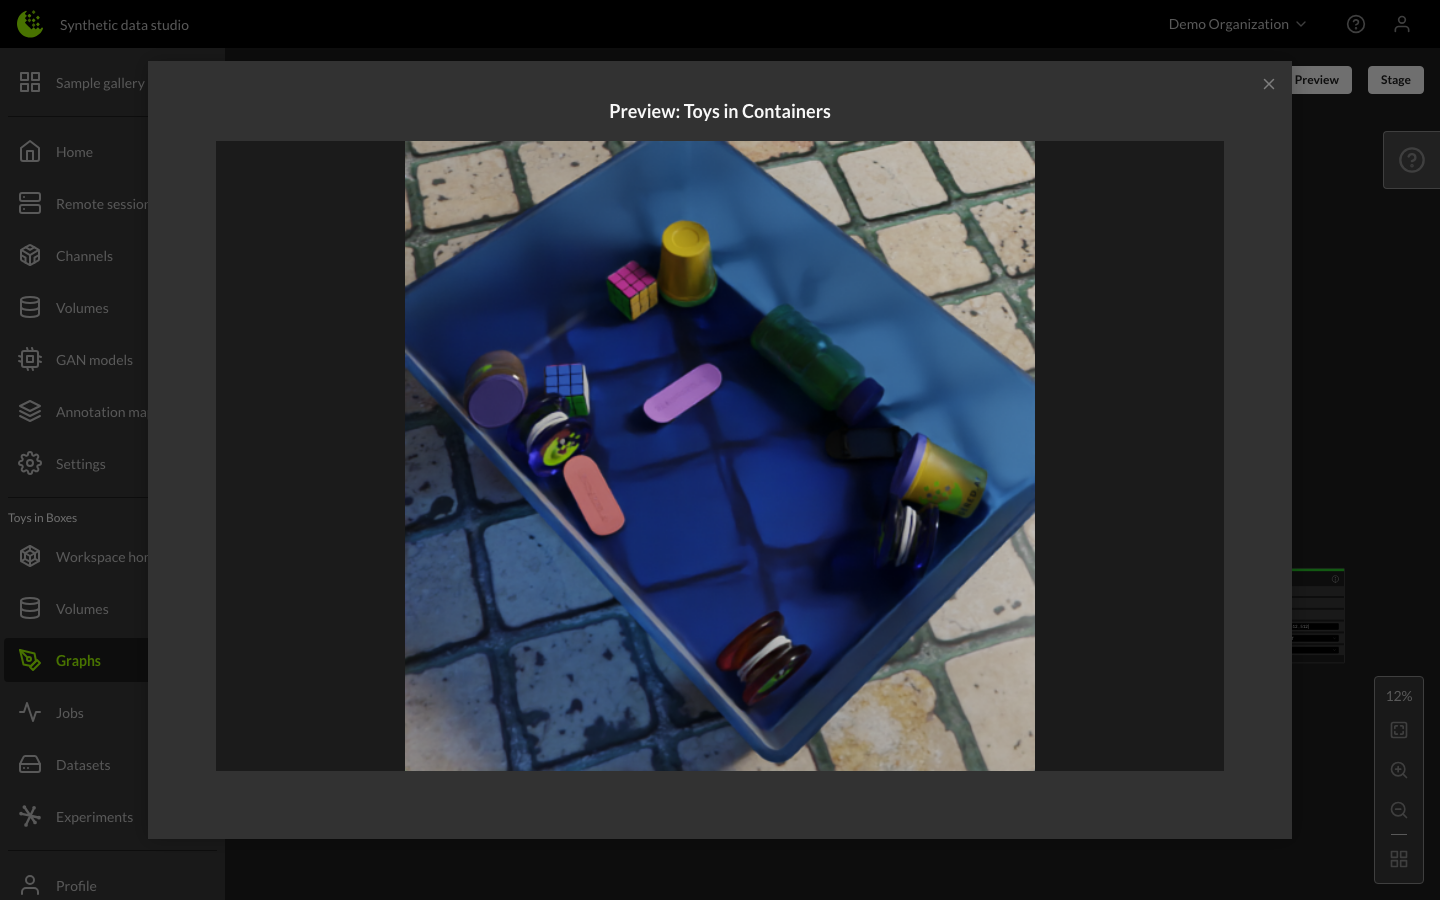
If the same graph is run multiple times in the workspace, preview caching will allow you to see the image right away. Preview can also be used to catch invalid graphs before staging. If a graph cannot be interpreted, the preview will result in an error message informing the user of the issue.
Staging
When you are satisfied with your graph and are ready to create a dataset, the graph needs to be staged. This will create an immutable version of the graph that can be referenced later.
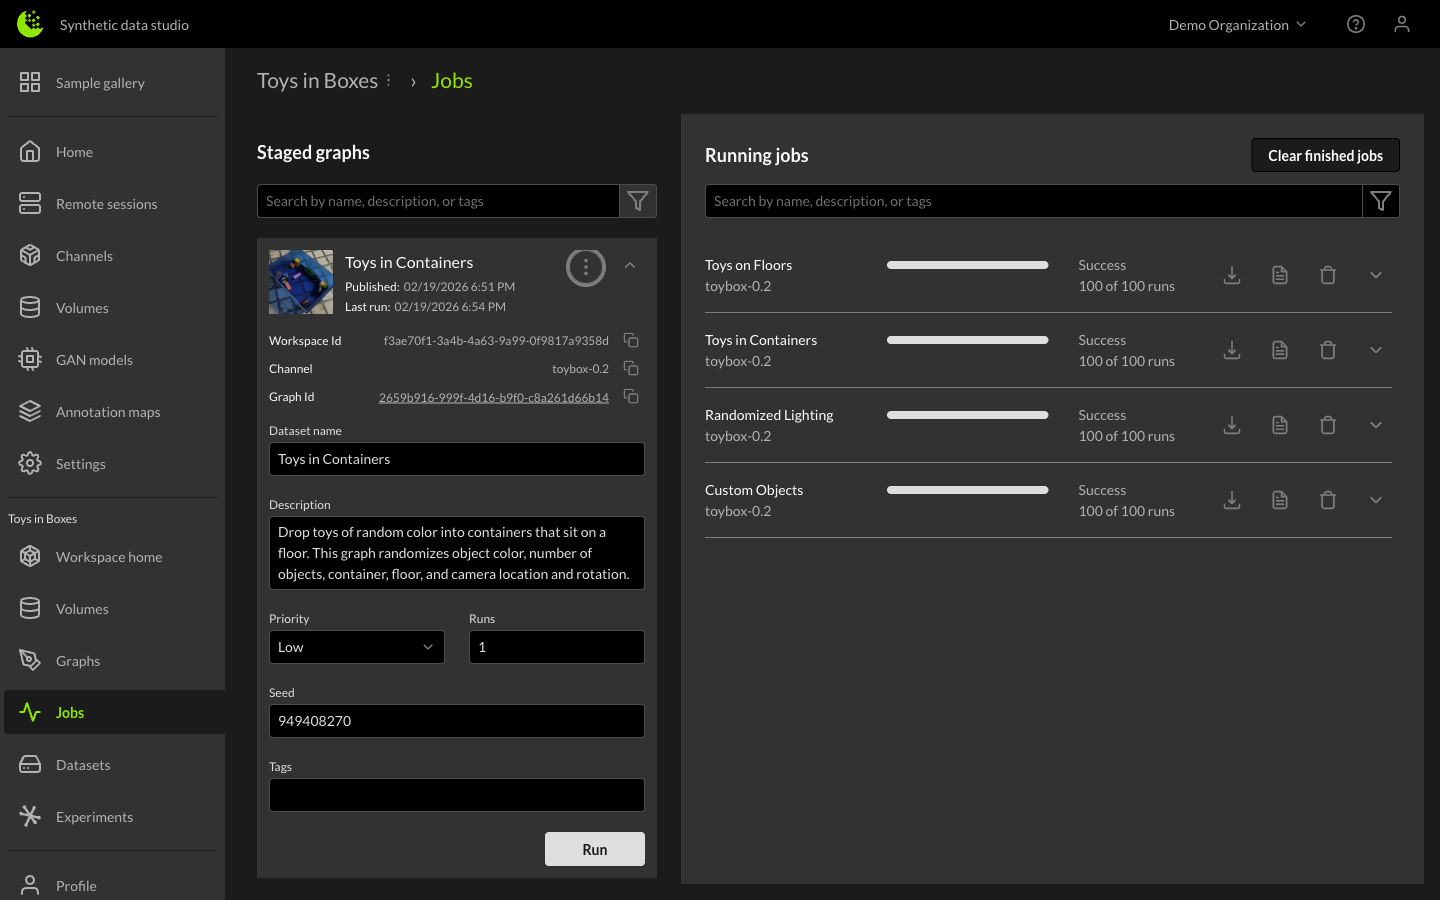
After clicking the Stage button in the upper right part of the screen, a new Staged Graph entry with the same name as the Graph will show up on the Jobs page.
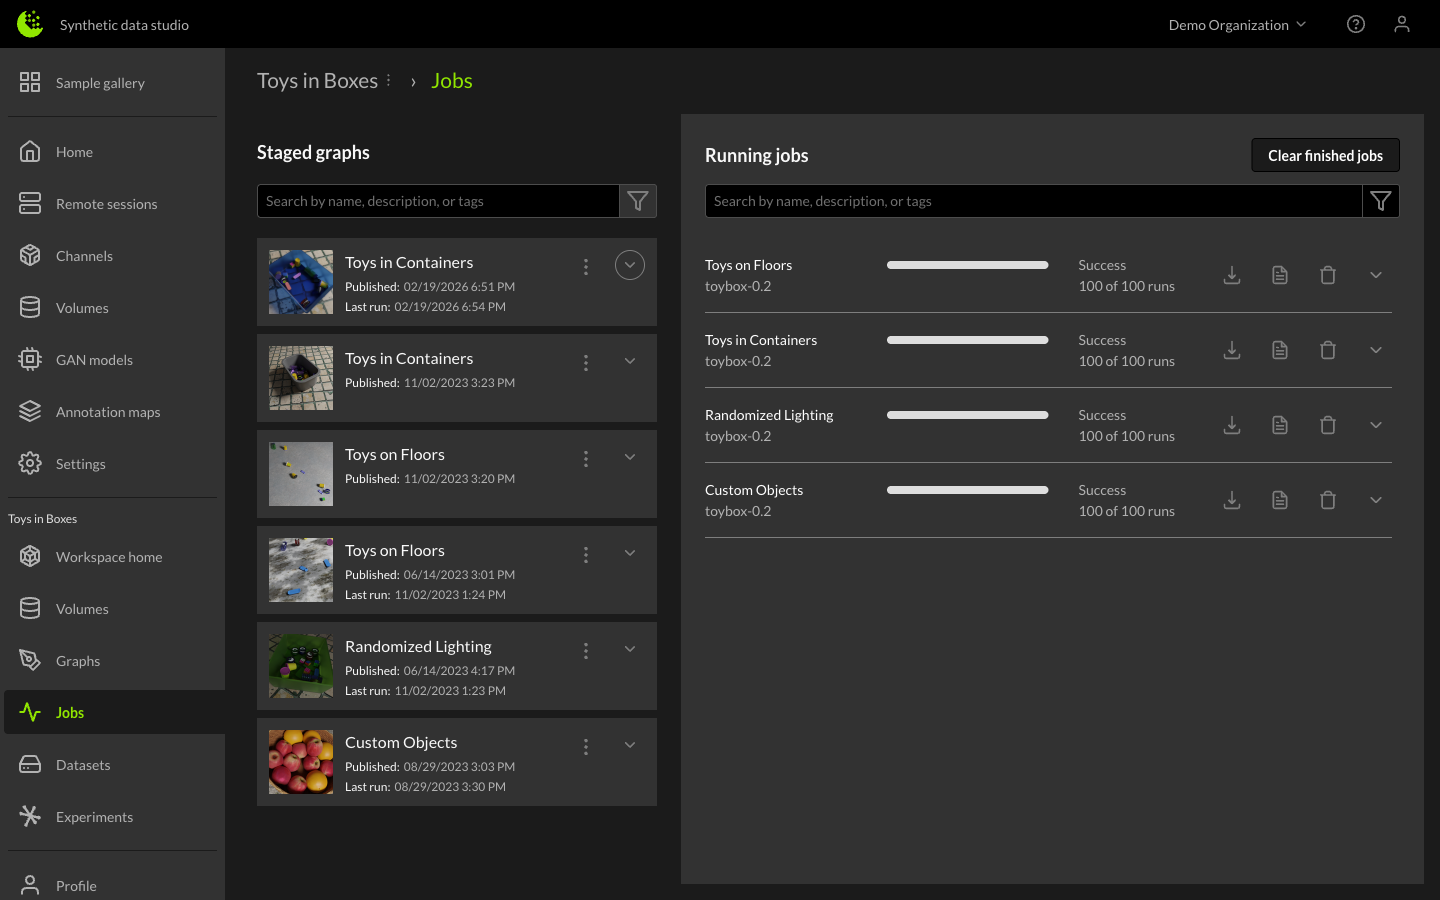
By selecting the dropdown arrow next to a staged graph entry, the run configuration is revealed. From here you can set the dataset name, description, priority, number of runs, seed, and tags before pressing the Run button to start a dataset job.
For more details on configuring and running dataset jobs, see Creating and Using Datasets.