Quick Start Guide
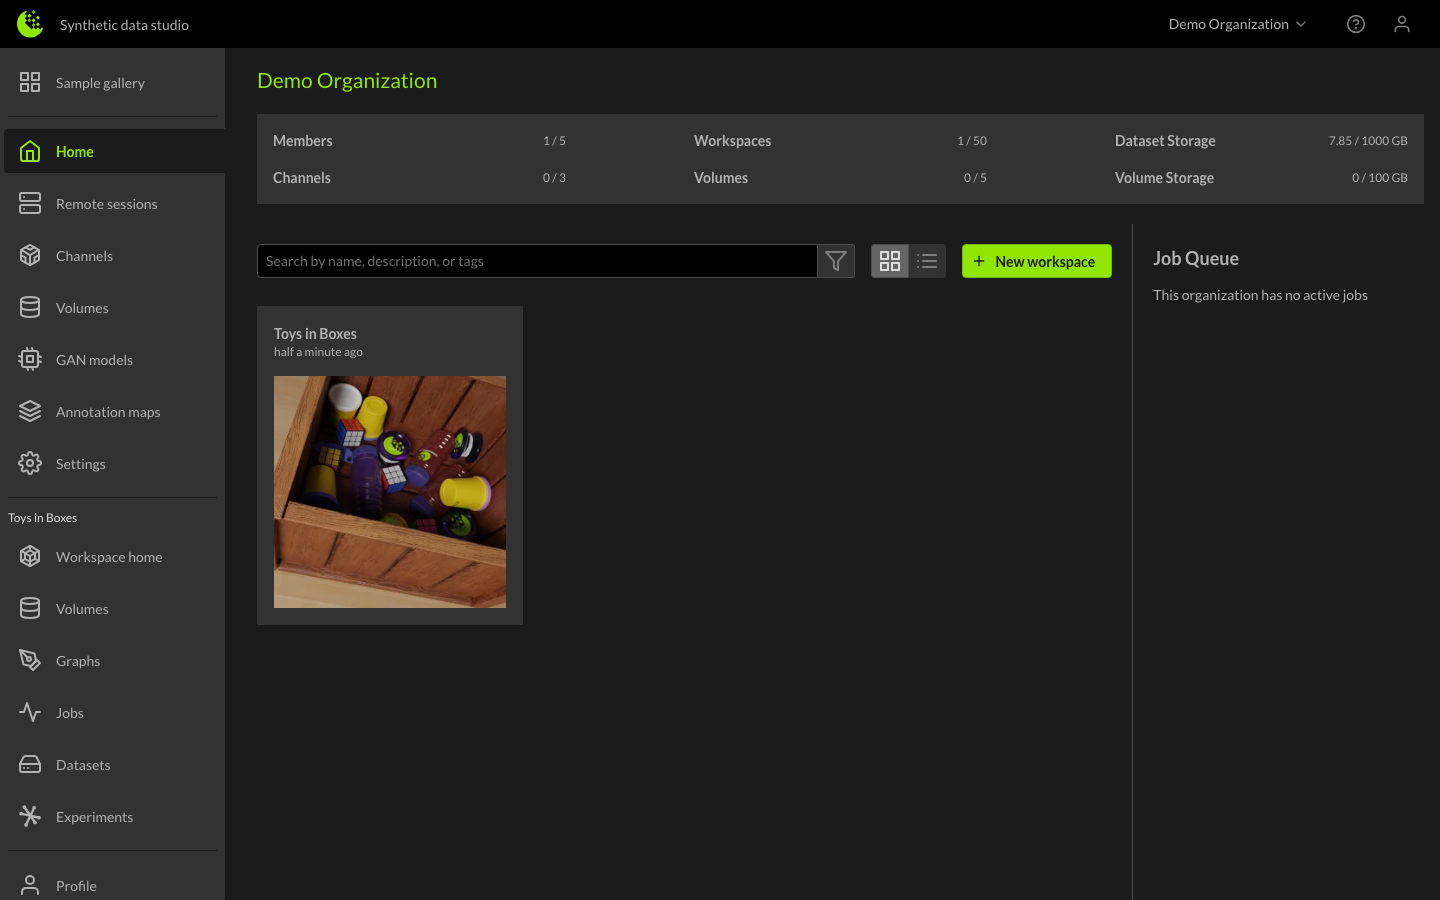
Follow these steps to start your journey by interfacing with the Rendered.ai web interface to create an account, configure a graph, run a job, and download the resulting dataset. After registration and signing in for the first time, users will be taken to the Landing page. The Landing page is where you can view recent work across organizations and drill down into the Organization-specific data quickly.
Setting up your Organization
New accounts with Rendered.ai will want to customize their Organization. The Organization is where all workspaces will be housed and where all members from your business will be able to share their work, contribute to channels, and generate new datasets. New accounts default to a user-based name so organizations will want to update the organization name through the Organization Settings page.
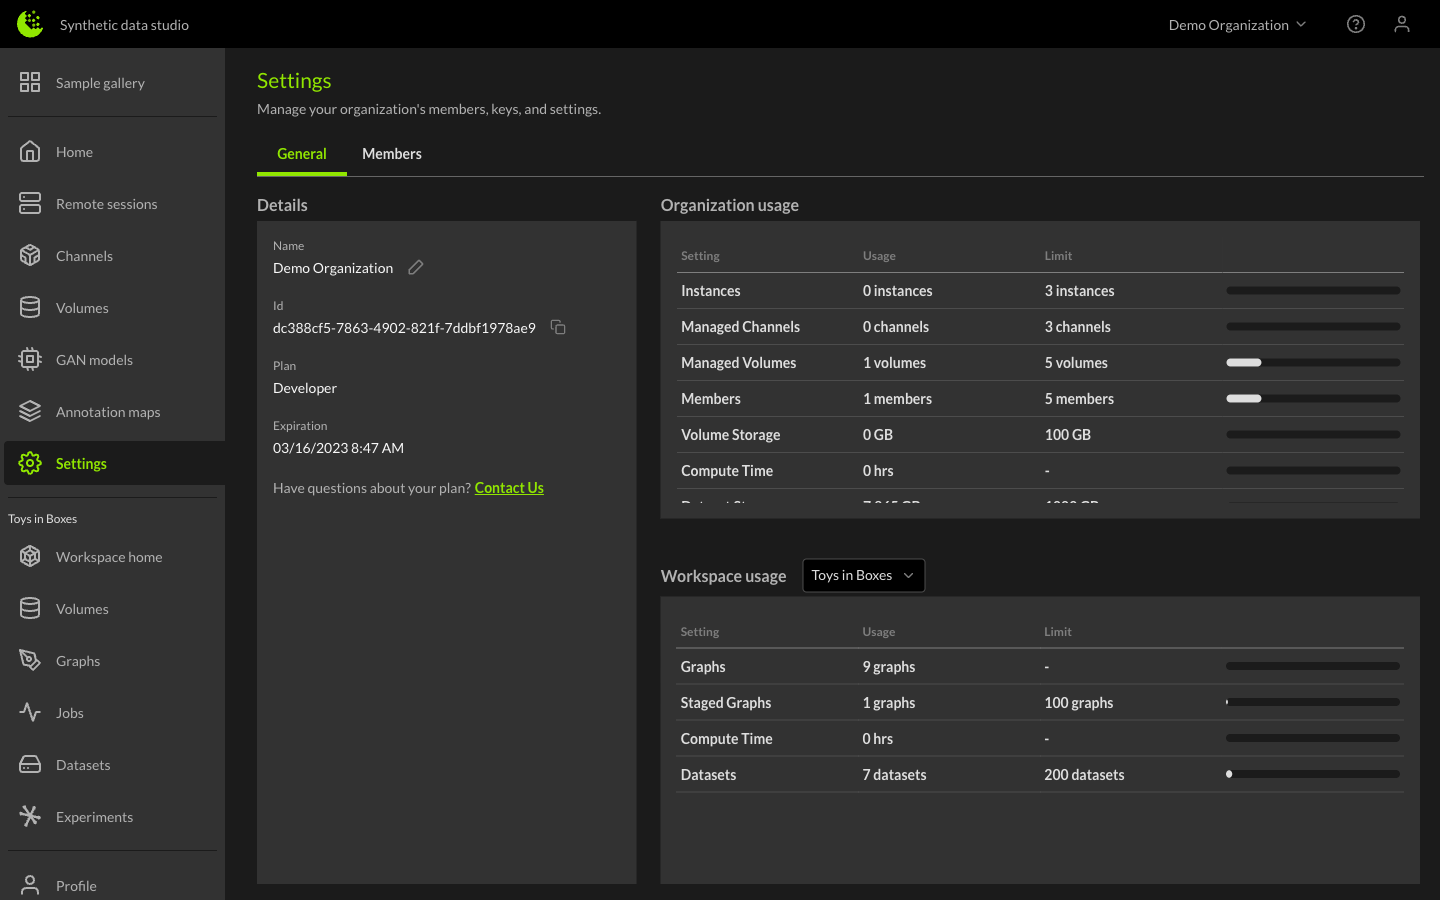
From the settings page, you can view the organization name, organization ID, plan details, and limitations. You can edit the organization name by clicking the pencil icon, entering the new name, and clicking the Save button.
Workspaces
Every new organization that is created within Rendered.ai is given a workspace. A workspace is a place to create graphs and generate datasets which may be shared within or outside your organization. To create a new workspace, select the organization and click the green New Workspace button.

In this example we are naming the workspace "Example" and adding the example channel. A Content Code can optionally be specified here for additional predefined data.
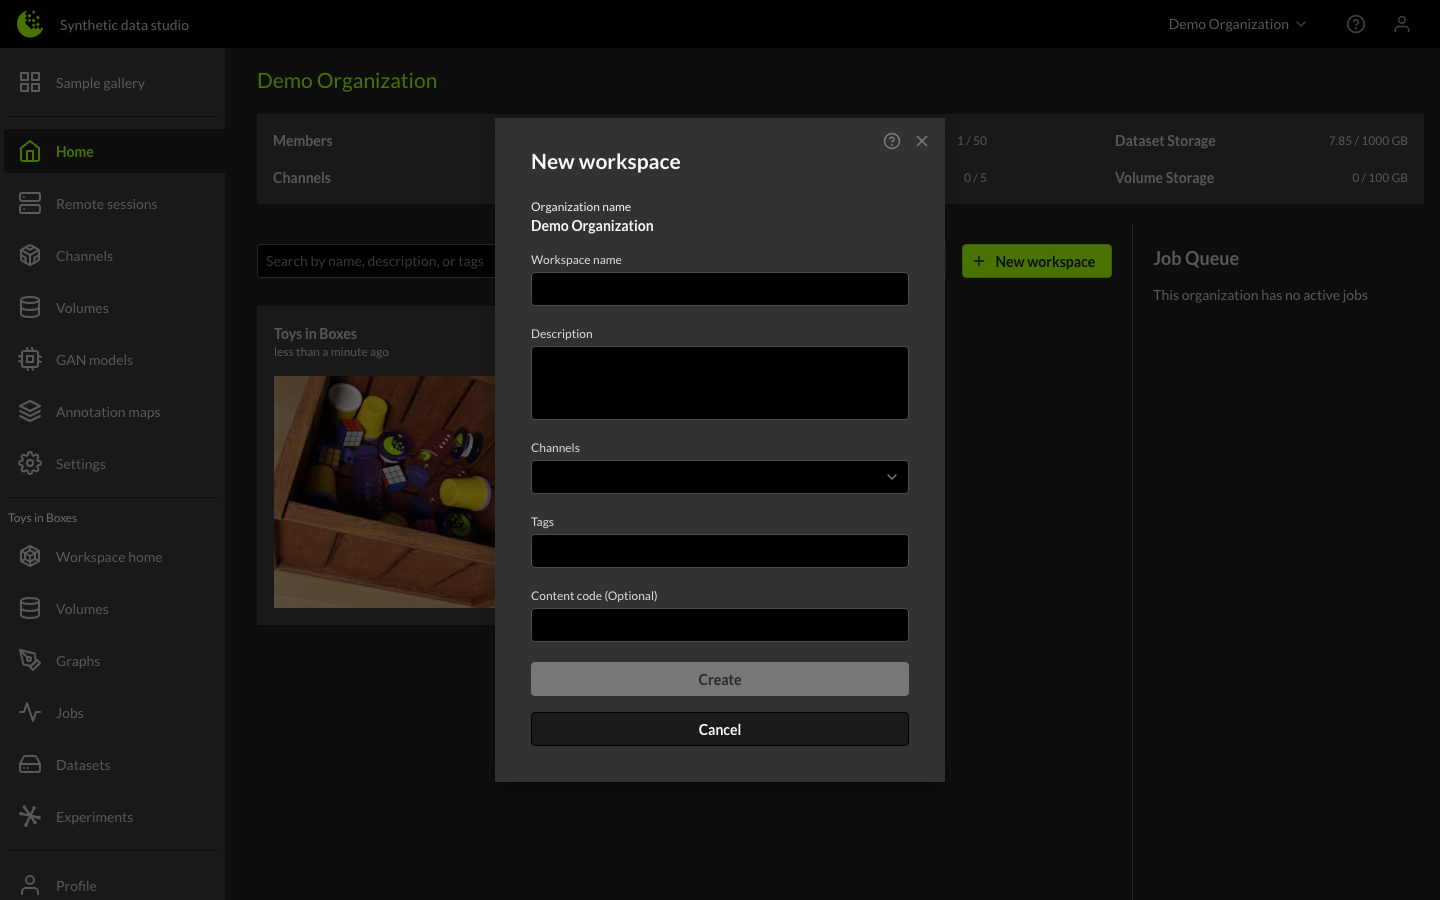
Channels define the simulation architecture (3D objects, backgrounds, sensors, sensor platforms, etc.) required to generate synthetic data. The Example channel is a generic channel (toys generated in a box) that allows you to experiment and learn the platform. The Example channel corresponds to the public GitHub codebase at Rendered-ai/example. New organizations receive the Example channel by default.
Rendered.ai develops additional channels that are available upon request, and also offers customization either through cloned Example codebase modifications or as engineering services.
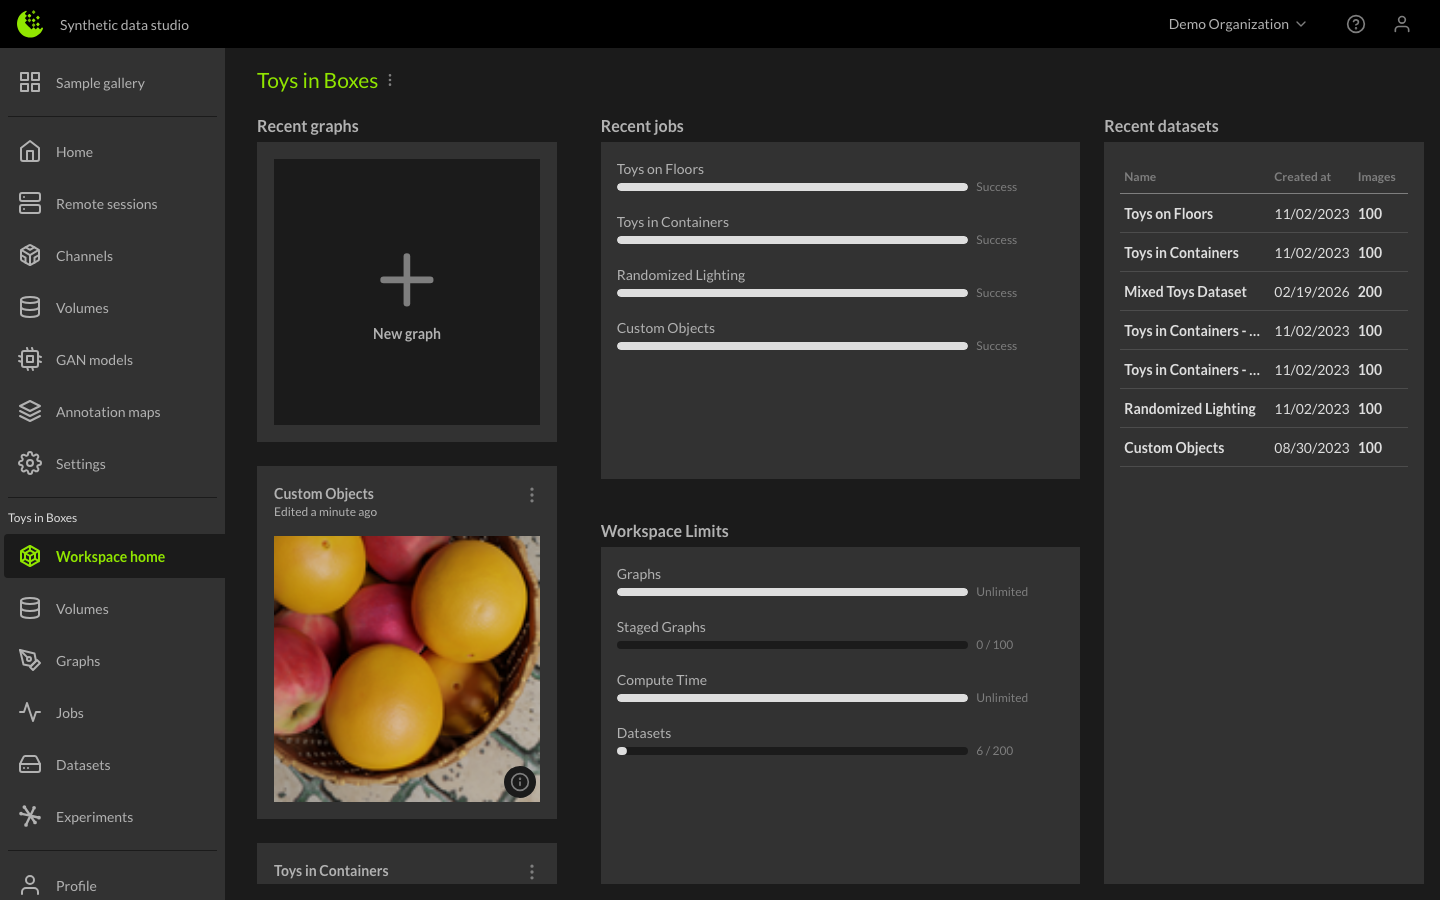
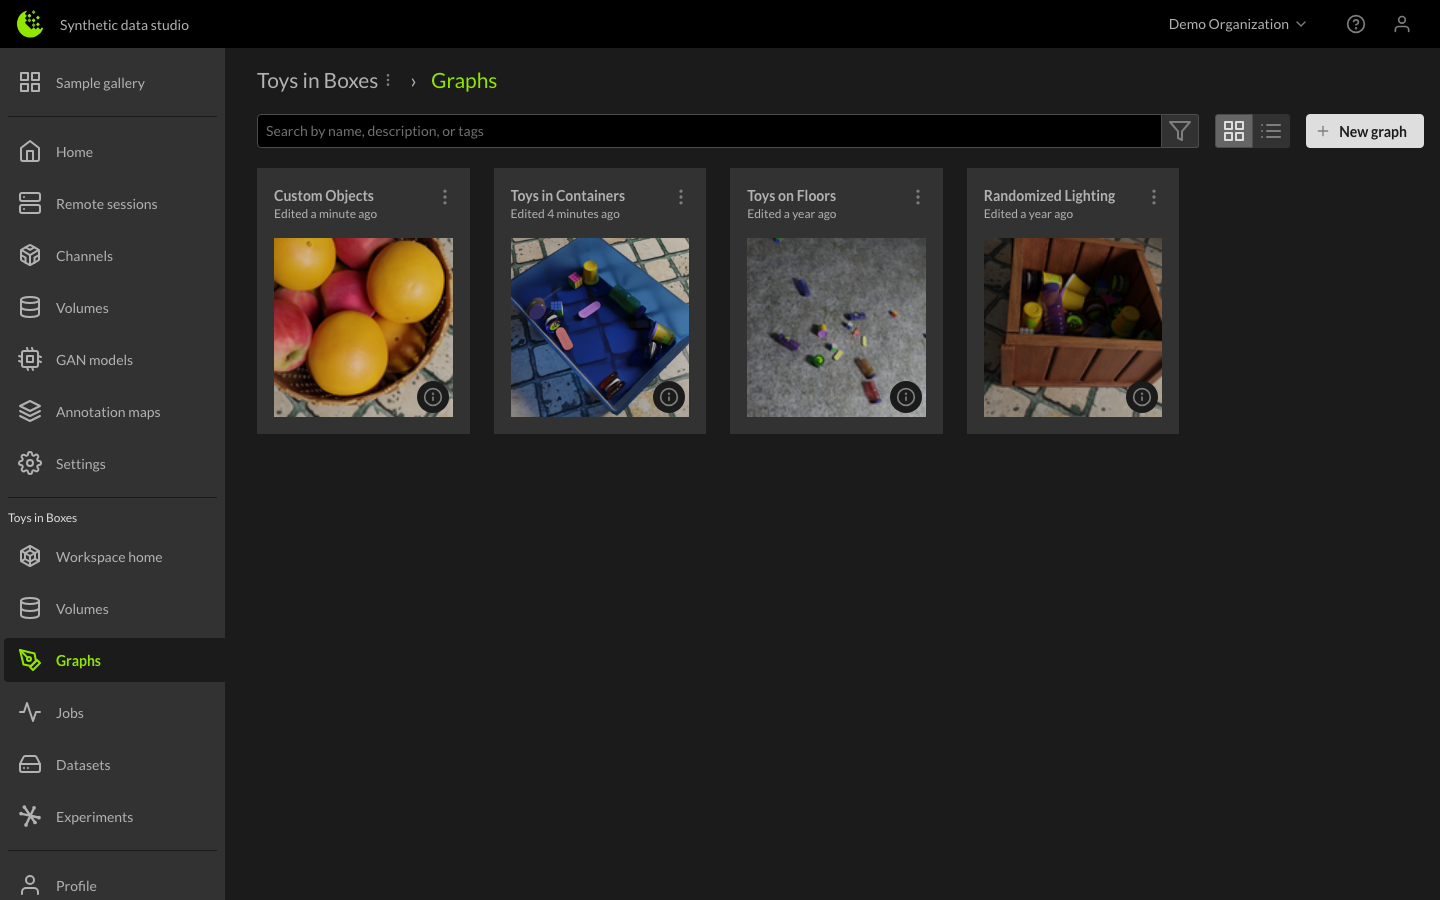
Once created, you will see an empty workspace ready for graphs and datasets.
Graphs within a Workspace
A graph is a visual diagram that is based on a channel's codebase, allowing you to view the objects and connections that exist in that channel, modify them within the diagram view, and stage the modified channel to produce simulation sets. To create a new graph, click the New Graph button in the workspace view.
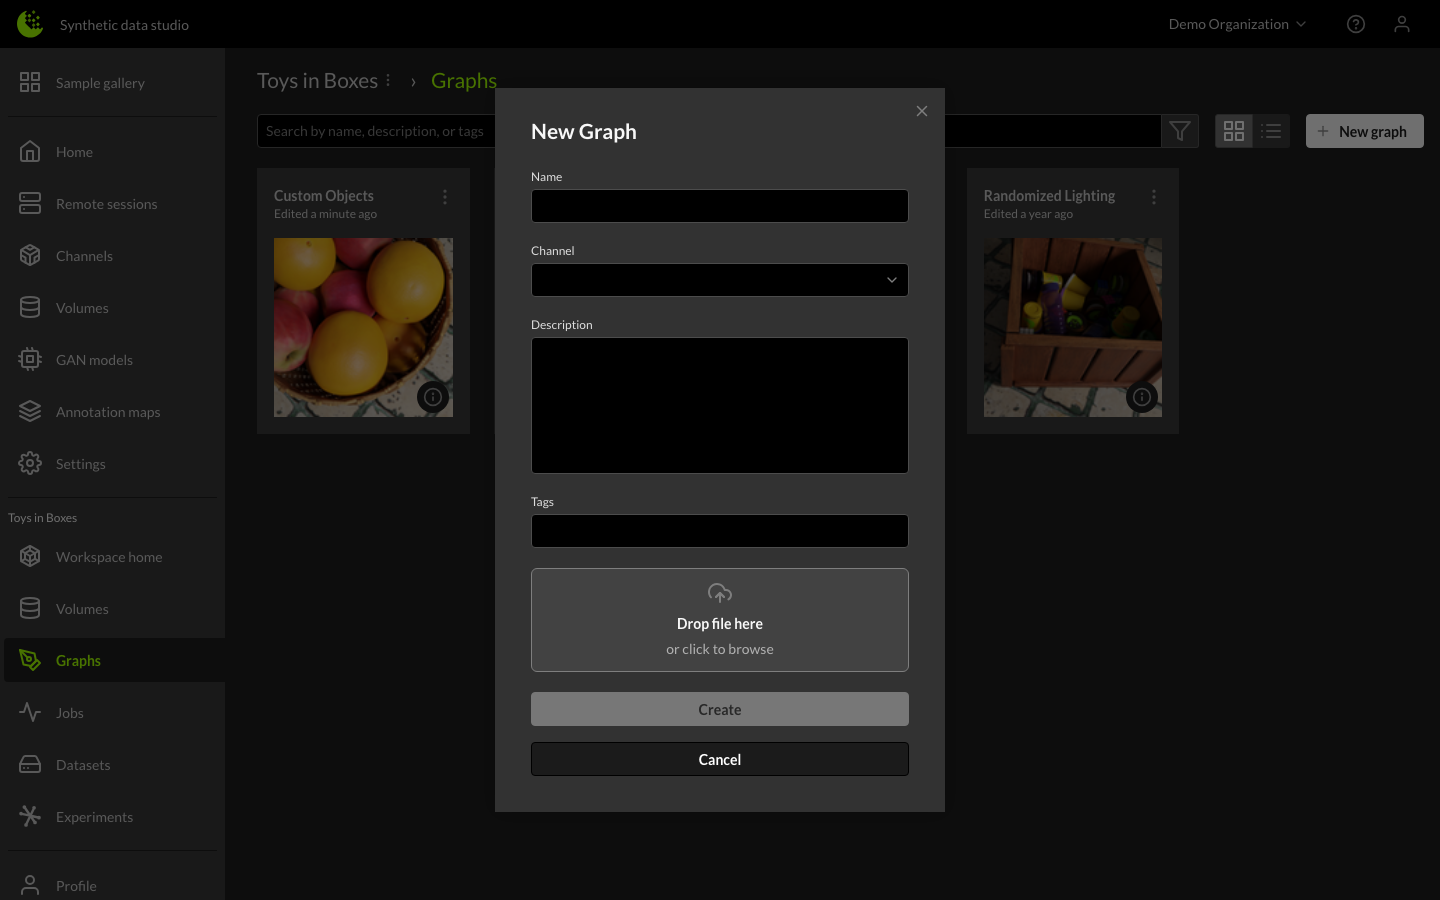
Enter a name for the graph, select a channel, and enter a description of the graph. You can also upload a JSON or YAML file. Finally, click on the Create button.
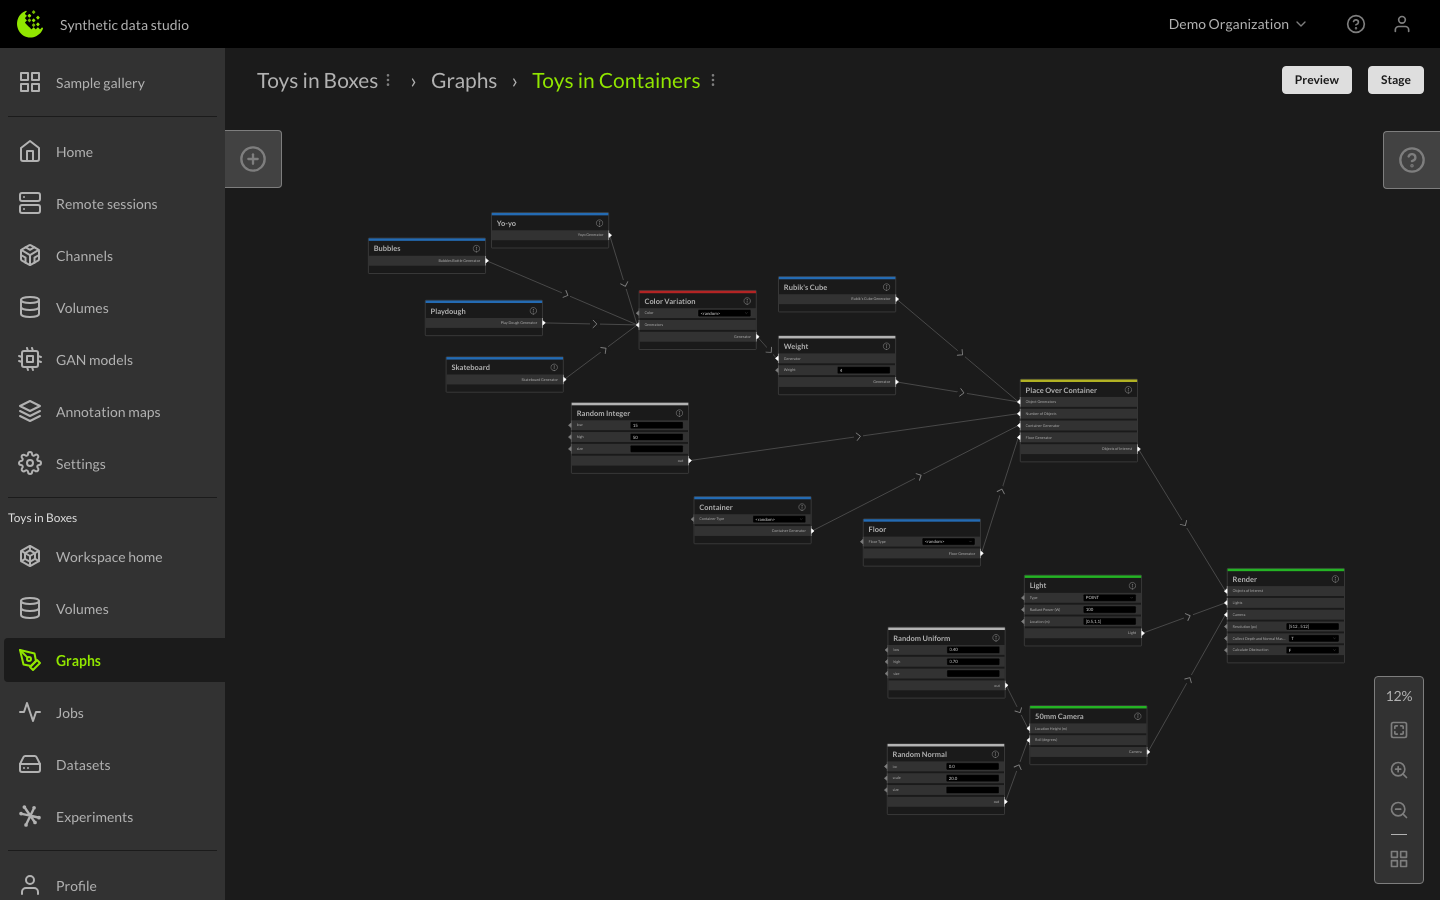
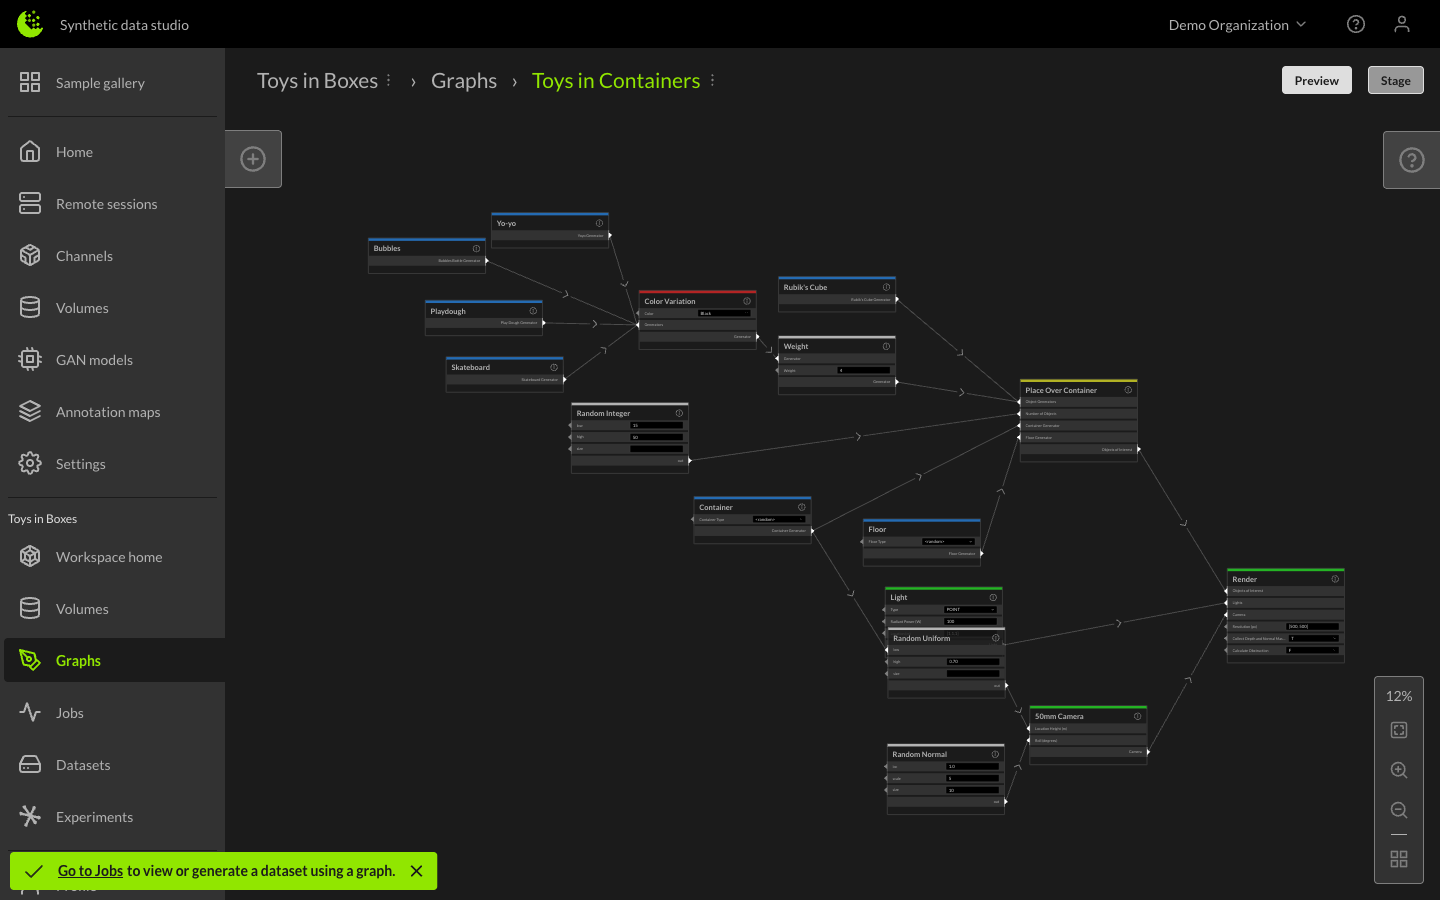
The graph editor will open showing the default graph for the selected channel. For more information about creating and using graphs, see Creating and Using Graphs and Graph Best Practices.

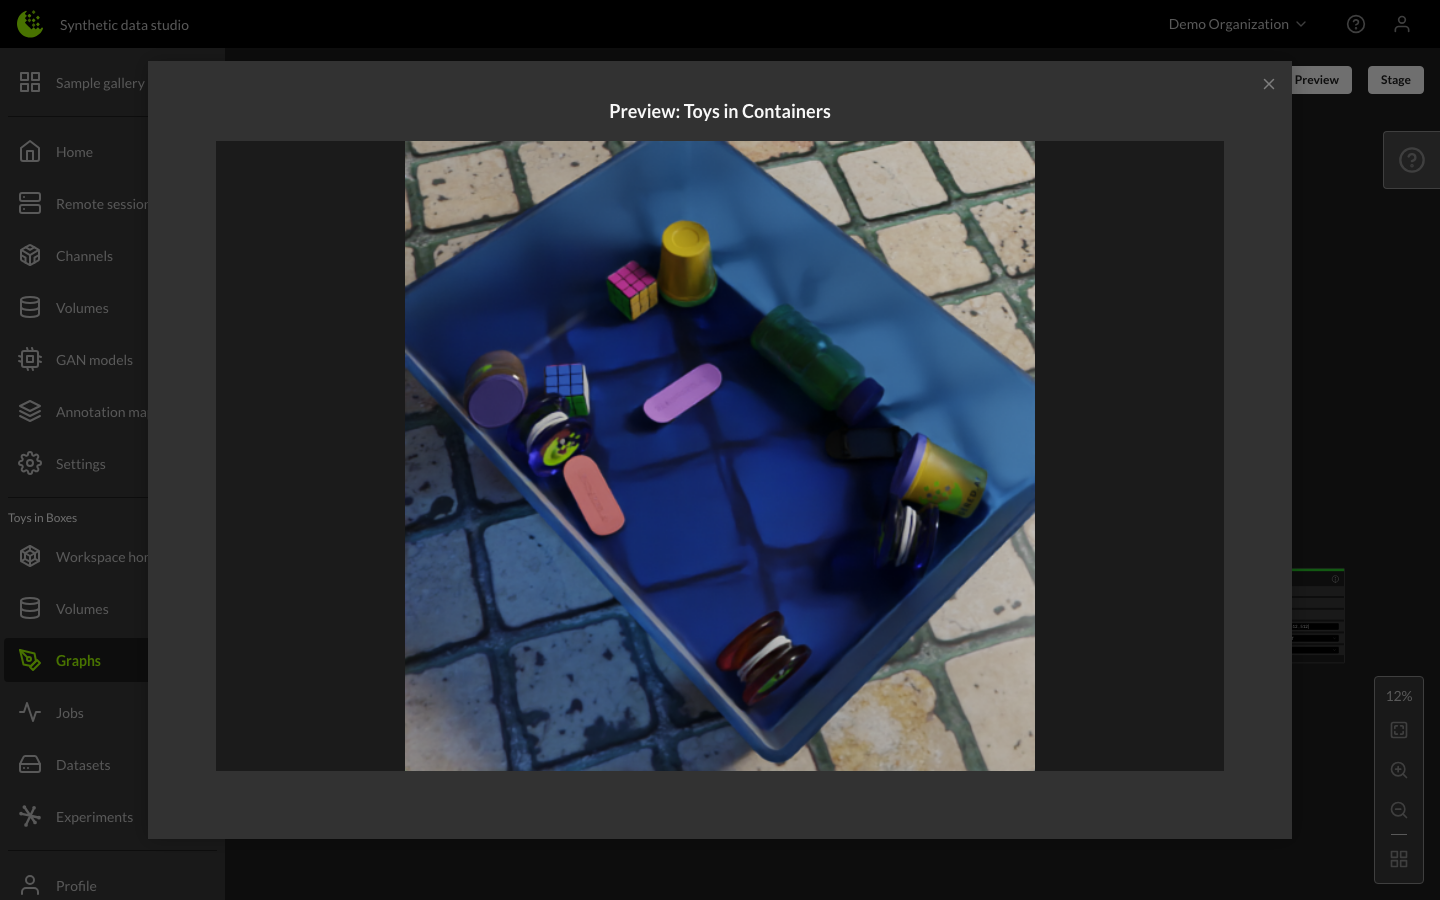
You can preview the output of your graph by clicking the Preview button. The Preview button renders a sample image of the provided graph configuration, allowing you to ensure your requirements are met before staging the graph for production.
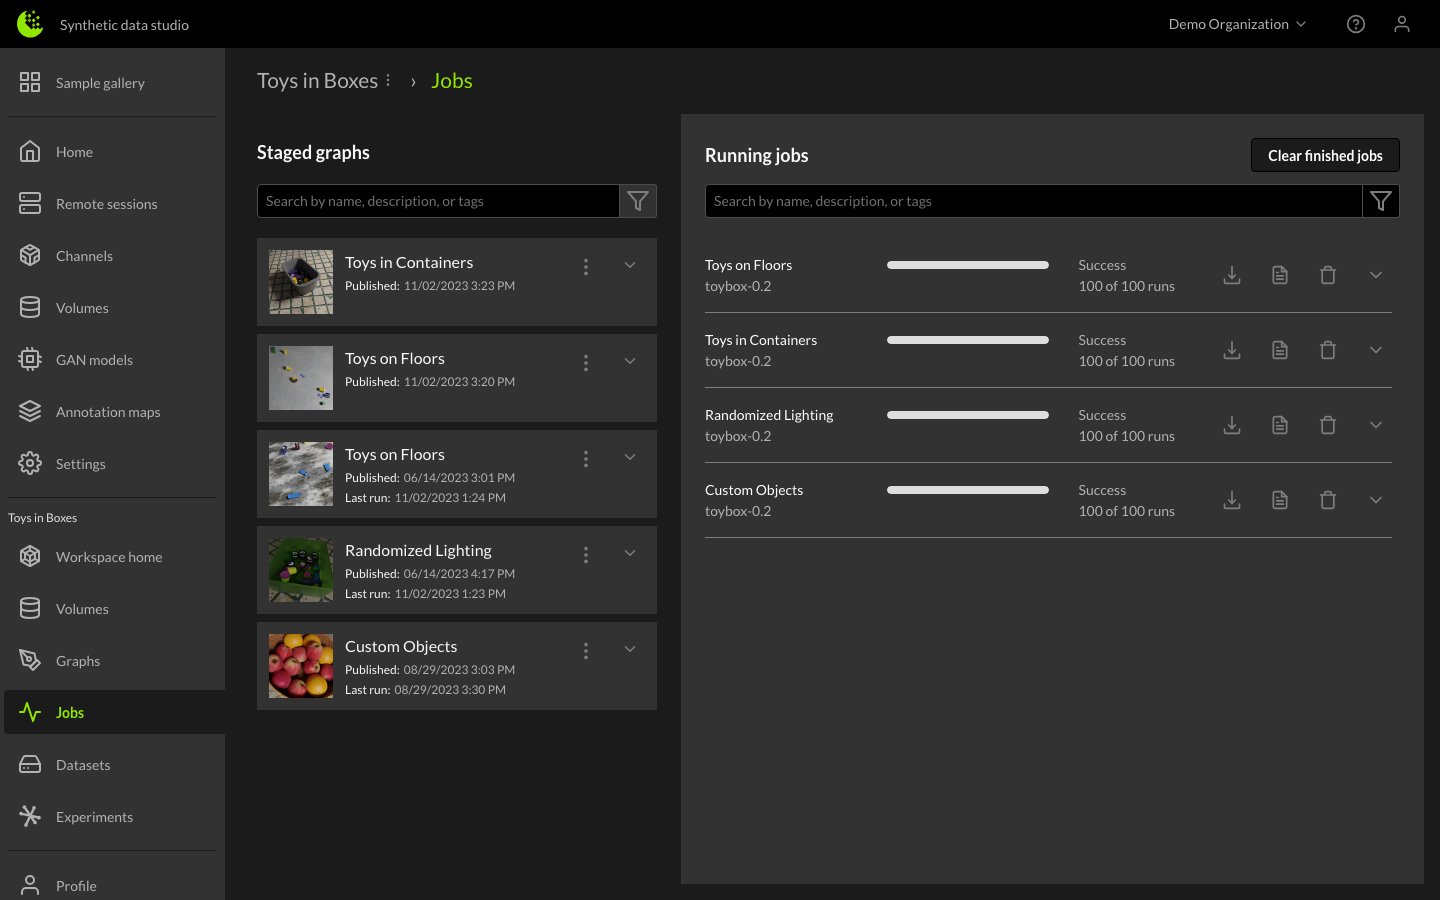
Staging Graphs within the Jobs Manager
Once the graph is providing a satisfactory output, it can be staged by clicking the Stage button. Staging a graph adds an item to the Staged Graphs section of the Jobs Manager.
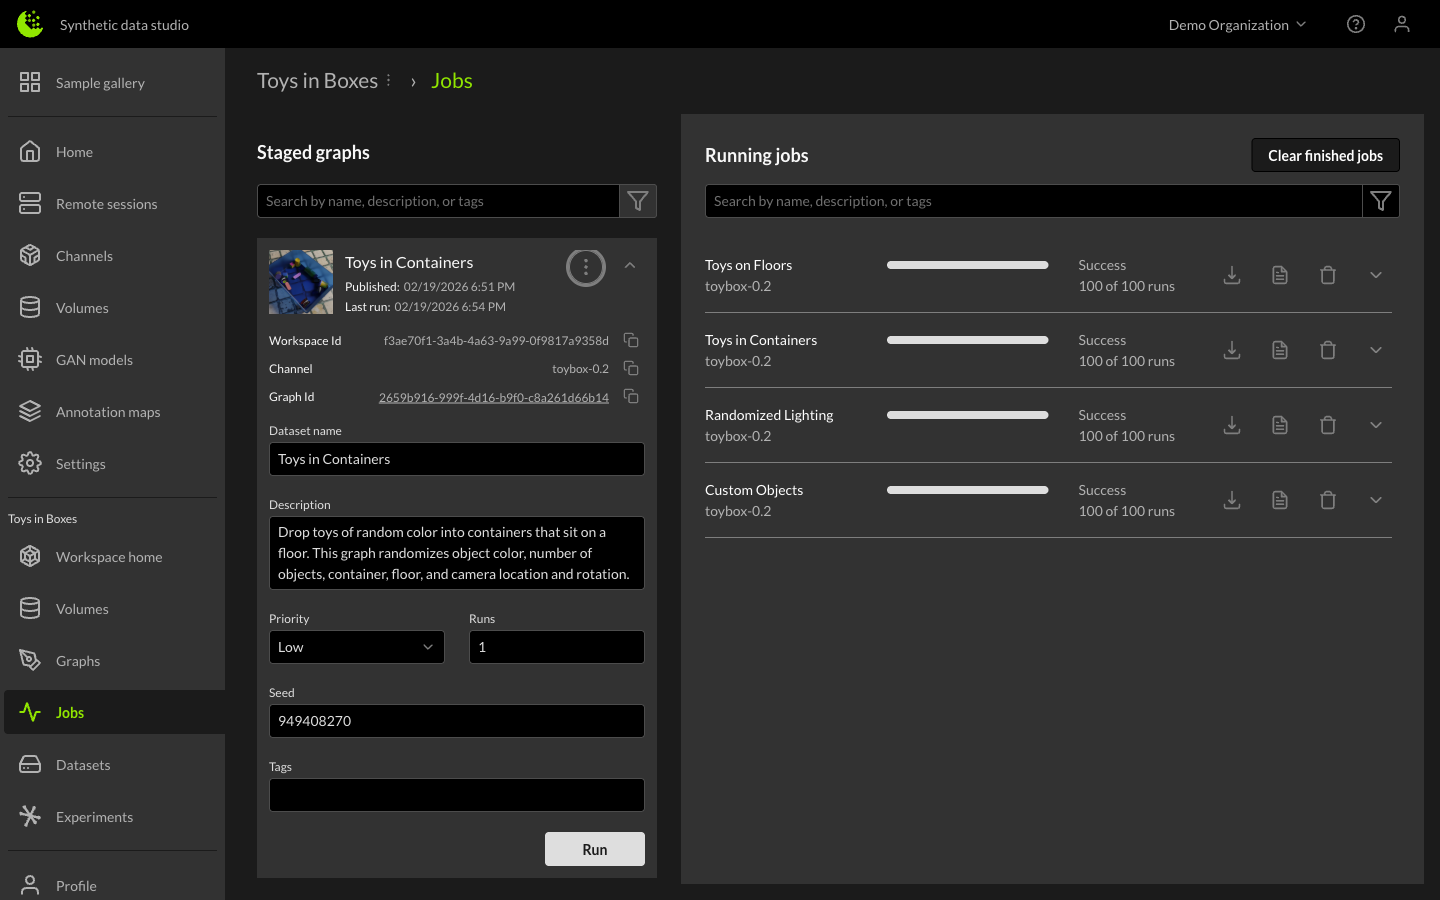
When configuring a dataset job, a name and description can be given to the output dataset, and you can specify the number of images to generate, as well as a specific seed to initialize the random number generators in order to match results across multiple runs if desired. Priority can also be designated when running multiple concurrent jobs. Click the down arrow next to the staged graph name to reveal these options, and click the Run button to start generating the dataset.
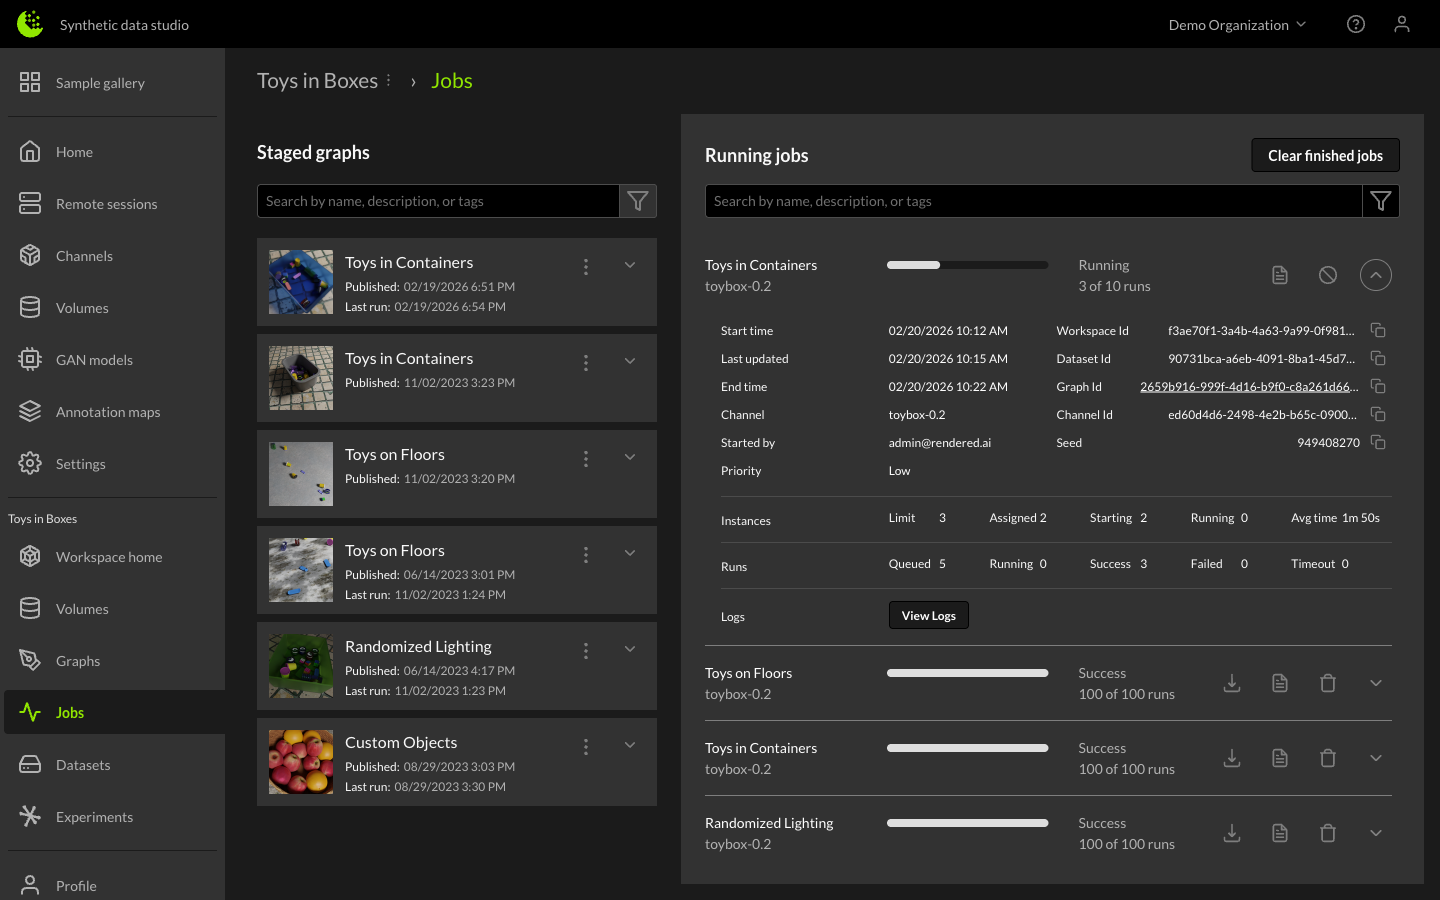
The right-side downward arrow provides more detailed status of the job, including average time per image, estimated end time, and compute instance information.
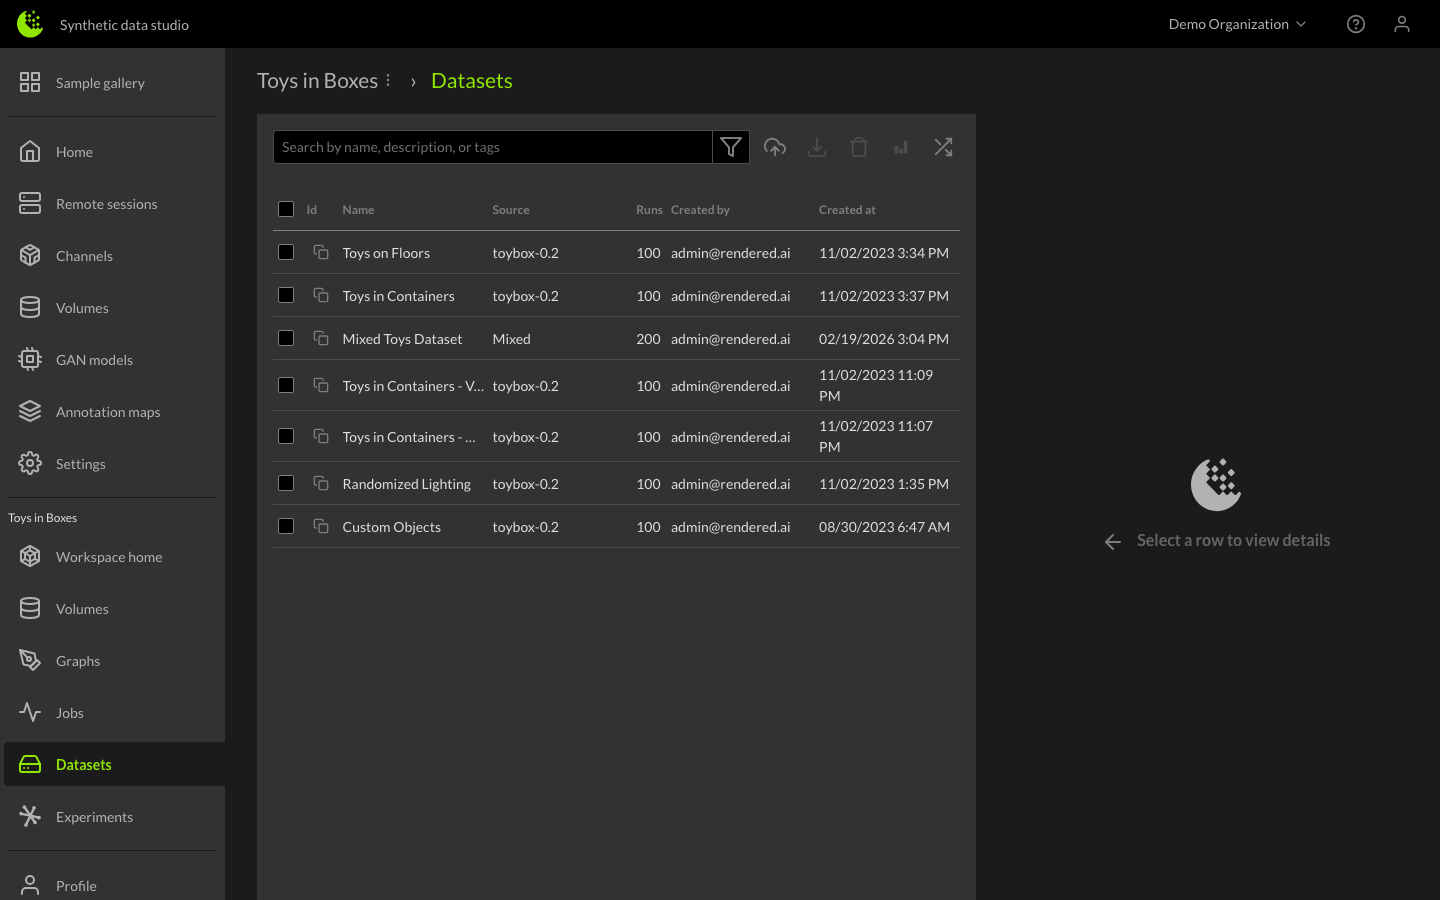
Dataset Library
Once the job is complete, you can find the dataset in the Datasets Library section of the workspace. From here, you can view more information about the dataset, download a compressed version, and begin using it to train your AI models. Additional services enable dataset learning, comparison, and annotation generation.
Next Steps
Now that you have set up your workspace, staged a graph, and created a dataset, learn more about managing your Organization and Workspace Resources.